NOAA radar and gauge estimate (MRMS), not a rain gauge reading.
Where is the field?
Map: last 7 days around the spot
Map: USGS The National Map
0.010.100.250.5011.5234+ inno data
Each square is about 2.8 miles north to south and 2 miles across. Tap the map to read any square.
Radar, lightning and hail on one clock for the last 24 or 48 hours, with the rain total. Estimates are labeled.
Checked against 1,175 NOAA co-op gauges, October 1 to 13, 2026: radar and gauge were a median 0.13 in apart on wet days. More in Sources and terms at the bottom.
Questions
Where does this rain number come from?
From NOAA’s Multi-Radar Multi-Sensor system (MRMS), which blends the national radar network with rain gauges that report every hour. This page uses its Pass 2 multi-sensor totals, the gauge-corrected run, averaged into squares about 2.8 miles by 2 miles. It is an estimate for the square your field sits in, not a reading from a gauge.
How close is the radar estimate to a rain gauge?
Checked against 1,175 NOAA co-op gauges in 47 states from October 1 to 13, 2026, radar and gauge were a median 0.13 inch apart on days with a tenth of an inch or more. On days a gauge caught half an inch or more, the median miss was 0.21 inch (20%), and radar read about 9% under the gauge. Over the 13 days added up, the median gap was 0.20 inch (13%).
Why does my rain gauge read different from the radar?
A gauge catches rain in a few square inches; the radar number is an average over a square of about six square miles. Radar sees rain above the ground, sometimes a mile up or more far from the radar, and wind, evaporation and hail all change what reaches the field. Gauges miss rain too, in wind and when they are read late. The two usually land close; on a heavy day expect a few tenths either way.
How often does it update?
About four times a day. NOAA posts its gauge-corrected totals about an hour after each hour ends, and the page takes a new total about every six hours. The page shows the newest hour in your time zone and says so if the data is more than 9 hours old.
Does it count snow?
It counts melted water, so snow shows up as its water content. Radar is weaker with snow than with rain, so treat winter numbers loosely.
Can I check a field instead of my ZIP?
Yes. Open a field or a point on Field Scout and follow its rain link, or tap anywhere on the map here to read that square. The page covers the lower 48 states. NOAA runs Alaska and Hawaii as separate radar rain grids, and this page does not read them yet.
Source. NOAA’s Multi-Radar Multi-Sensor system (MRMS), Pass 2 multi-sensor totals: every NWS radar blended with rain gauges that report each hour, the run that waits about an hour for more gauges. NOAA’s grid is averaged into squares about 2.8 miles north to south and 2 miles across, rounded to the hundredth of an inch. Gauge comparison: NOAA co-op and CoCoRaHS daily reports. Map: USGS The National Map (map services and data from the U.S. Geological Survey, National Geospatial Program); state lines from Natural Earth.
Windows. All of them end at the newest hour NOAA has posted. This month runs from midnight Central on the 1st. If any piece of a window is missing, that window is left off rather than guessed.
How close radar comes to a gauge.
I checked the estimate against 1,175 NOAA co-op rain gauges in 47 states, every morning report from October 1 to 13, 2026 (14,476 gauge-days), using the same squares this page shows.
On days with a tenth of an inch or more at the gauge or on radar (2,473 of them), radar and gauge were a median 0.13 in apart. Radar ran a little low: 0.03 in under on average.
On days the gauge caught half an inch or more (1,032), the median miss was 0.21 in, or 20%, and radar read about 9% under the gauge.
Added up over the 13 days, at the 623 gauges that reported every day and caught half an inch or more, the median gap was 0.20 in (13%).
About 1 wet day in 17, radar showed a tenth or more where the gauge caught nothing, and about 1 in 15 the other way.
That is two weeks of fall rain. Summer thunderstorms are harder on radar, and I will run the check again in storm season. Your own gauge can differ from both: a storm can drop an inch on one side of a section and a quarter inch on the other.
Squares left out. A few NOAA squares read rain when none fell. One near Mount Baker, Washington, read half an inch to more than an inch a day on dry days all fall 2026 while every square around it read none, so it shows as no data. A lone reading far above every square around it shows as no data too, in every window, not only the one it was caught in.
The gauge beside it. The county gauges are the stations on the county rain pages. Their days end at the morning reading, so the radar number beside them is NOAA’s 24-hour total ending at 6 am Central standard time (7 am daylight time), added over the same days. Airport stations close their day at midnight and are left out. Gauge reports come in about once a week.
An estimate, not a gauge reading.
How much rain has your county had this year?
Type your county or ZIP, or pick your state. Each county page gives the rain so far in 2026 at a weather station in that county, against a normal year, month by month. The counties having a record year are below the states.
Counties at their wettest or driest year to date on record, longest records first.
Grundy County, IA: the wettest by Nov 10 of 109 years on record (1893 on). 47.08 in., 141% of normal.
Missaukee County, MI: the wettest by Nov 5 of 94 years on record (1898 on). 39.26 in., 133% of normal.
Ogemaw County, MI: the wettest by Nov 14 of 102 years on record (1901 on). 40.56 in., 135% of normal.
Campbell County, WY: the driest by Nov 14 of 99 years on record (1905 on). 7.37 in., 44% of normal.
Boone County, IA: the wettest by Nov 14 of 108 years on record (1905 on). 54.33 in., 149% of normal.
See all 24 record counties
Bolivar County, MS: the driest by Nov 14 of 88 years on record (1912 on). 25.31 in., 50% of normal.
Alpena County, MI: the wettest by Nov 14 of 109 years on record (1917 on). 36.90 in., 138% of normal.
Greene County, OH: the wettest by Nov 14 of 88 years on record (1923 on). 50.04 in., 130% of normal.
Drew County, AR: the driest by Nov 14 of 79 years on record (1938 on). 23.38 in., 53% of normal.
Orleans County, NY: the wettest by Nov 14 of 70 years on record (1939 on). 44.15 in., 142% of normal.
Kimble County, TX: the wettest by Nov 14 of 49 years on record (1948 on). 40.91 in., 199% of normal.
Mecklenburg County, VA: the driest by Nov 14 of 74 years on record (1949 on). 21.75 in., 57% of normal.
Garland County, AR: the driest by Nov 14 of 71 years on record (1954 on). 23.46 in., 48% of normal.
Rockingham County, NC: the driest by Nov 14 of 62 years on record (1963 on). 21.61 in., 51% of normal.
Skamania County, WA: the driest by Nov 9 of 57 years on record (1966 on). 45.31 in., 73% of normal.
Lenoir County, NC: the driest by Nov 13 of 54 years on record (1967 on). 29.12 in., 61% of normal.
Wayne County, IN: the wettest by Nov 14 of 53 years on record (1969 on). 56.62 in., 152% of normal.
Delaware County, IA: the wettest by Nov 14 of 49 years on record (1977 on). 52.81 in., 148% of normal.
Wheeler County, OR: the driest by Nov 10 of 45 years on record (1981 on). 12.20 in., 56% of normal.
Sussex County, VA: the driest by Nov 14 of 41 years on record (1983 on). 27.35 in., 59% of normal.
Iron County, WI: the driest by Nov 14 of 36 years on record (1988 on). 21.07 in., 64% of normal.
Leelanau County, MI: the wettest by Nov 14 of 39 years on record (1988 on). 37.93 in., 132% of normal.
Johnson County, AR: the driest by Nov 14 of 35 years on record (1990 on). 32.81 in., 71% of normal.
Androscoggin County, ME: the driest by Nov 14 of 33 years on record (1994 on). 30.86 in., 72% of normal.
How the numbers are counted
One weather station inside each county, reporting at least 90% of the days this year. A county without one points to the nearest that has one.
A day not reported is unknown, not dry: it adds to neither the total nor the normal year.
Normal is NOAA’s 1991 to 2020 daily average for each station, added up over the same days. NOAA’s numbers come in a few days late, so the pages are updated every day and each one says the day its numbers run through.
A record counts the past years in which the station reported at least 95% of the days to the same date (3 missed days are always allowed). A dry record waits when this year’s own missed days could have held enough rain to undo it. A station 25 points or more from its county average is left off: one gauge, not the county.
All states
Alabama 58 counties, typical county 92% of normal, 2026 through Nov 14
Alaska 23 boroughs and census areas, typical borough or census area 106% of normal, 2026 through Nov 14
Arizona 14 counties, typical county 134% of normal, 2026 through Nov 14
Arkansas 63 counties, typical county 70% of normal, 2026 through Nov 14
California 55 counties, typical county 77% of normal, 2026 through Nov 14
Colorado 64 counties, typical county 89% of normal, 2026 through Nov 14
Connecticut 8 counties, typical county 100% of normal, 2026 through Nov 14
Delaware 3 counties, typical county 85% of normal, 2026 through Nov 14
Florida 59 counties, typical county 97% of normal, 2026 through Nov 14
Georgia 103 counties, typical county 87% of normal, 2026 through Nov 14
Hawaii 4 counties, typical county 188% of normal, 2026 through Nov 14
Idaho 42 counties, typical county 87% of normal, 2026 through Nov 14
Illinois 93 counties, typical county 105% of normal, 2026 through Nov 14
Indiana 87 counties, typical county 106% of normal, 2026 through Nov 14
Iowa 88 counties, typical county 118% of normal, 2026 through Nov 14
Kansas 104 counties, typical county 108% of normal, 2026 through Nov 14
Kentucky 85 counties, typical county 89% of normal, 2026 through Nov 14
Louisiana 57 parishes, typical parish 78% of normal, 2026 through Nov 14
Maine 16 counties, typical county 77% of normal, 2026 through Nov 14
Maryland 23 counties, typical county 82% of normal, 2026 through Nov 14
Massachusetts 14 counties, typical county 86% of normal, 2026 through Nov 14
Michigan 77 counties, typical county 106% of normal, 2026 through Nov 14
Minnesota 82 counties, typical county 92% of normal, 2026 through Nov 14
Mississippi 49 counties, typical county 78% of normal, 2026 through Nov 14
Missouri 107 counties, typical county 99% of normal, 2026 through Nov 14
Montana 53 counties, typical county 102% of normal, 2026 through Nov 14
Nebraska 84 counties, typical county 102% of normal, 2026 through Nov 14
Nevada 16 counties, typical county 82% of normal, 2026 through Nov 14
New Hampshire 10 counties, typical county 87% of normal, 2026 through Nov 14
New Jersey 21 counties, typical county 100% of normal, 2026 through Nov 14
New Mexico 33 counties, typical county 121% of normal, 2026 through Nov 14
New York 59 counties, typical county 98% of normal, 2026 through Nov 14
North Carolina 94 counties, typical county 76% of normal, 2026 through Nov 14
North Dakota 34 counties, typical county 83% of normal, 2026 through Nov 14
Ohio 83 counties, typical county 109% of normal, 2026 through Nov 14
Oklahoma 65 counties, typical county 84% of normal, 2026 through Nov 14
Oregon 34 counties, typical county 71% of normal, 2026 through Nov 14
Pennsylvania 60 counties, typical county 98% of normal, 2026 through Nov 14
Rhode Island 5 counties, typical county 110% of normal, 2026 through Nov 14
South Carolina 43 counties, typical county 78% of normal, 2026 through Nov 14
South Dakota 64 counties, typical county 92% of normal, 2026 through Nov 14
Tennessee 89 counties, typical county 84% of normal, 2026 through Nov 14
Texas 214 counties, typical county 92% of normal, 2026 through Nov 14
Utah 29 counties, typical county 106% of normal, 2026 through Nov 14
Vermont 13 counties, typical county 93% of normal, 2026 through Nov 14
Virginia 102 counties, typical county 86% of normal, 2026 through Nov 14
Washington 39 counties, typical county 76% of normal, 2026 through Nov 14
West Virginia 44 counties, typical county 103% of normal, 2026 through Nov 14
Wisconsin 69 counties, typical county 103% of normal, 2026 through Nov 14
Wyoming 23 counties, typical county 78% of normal, 2026 through Nov 14
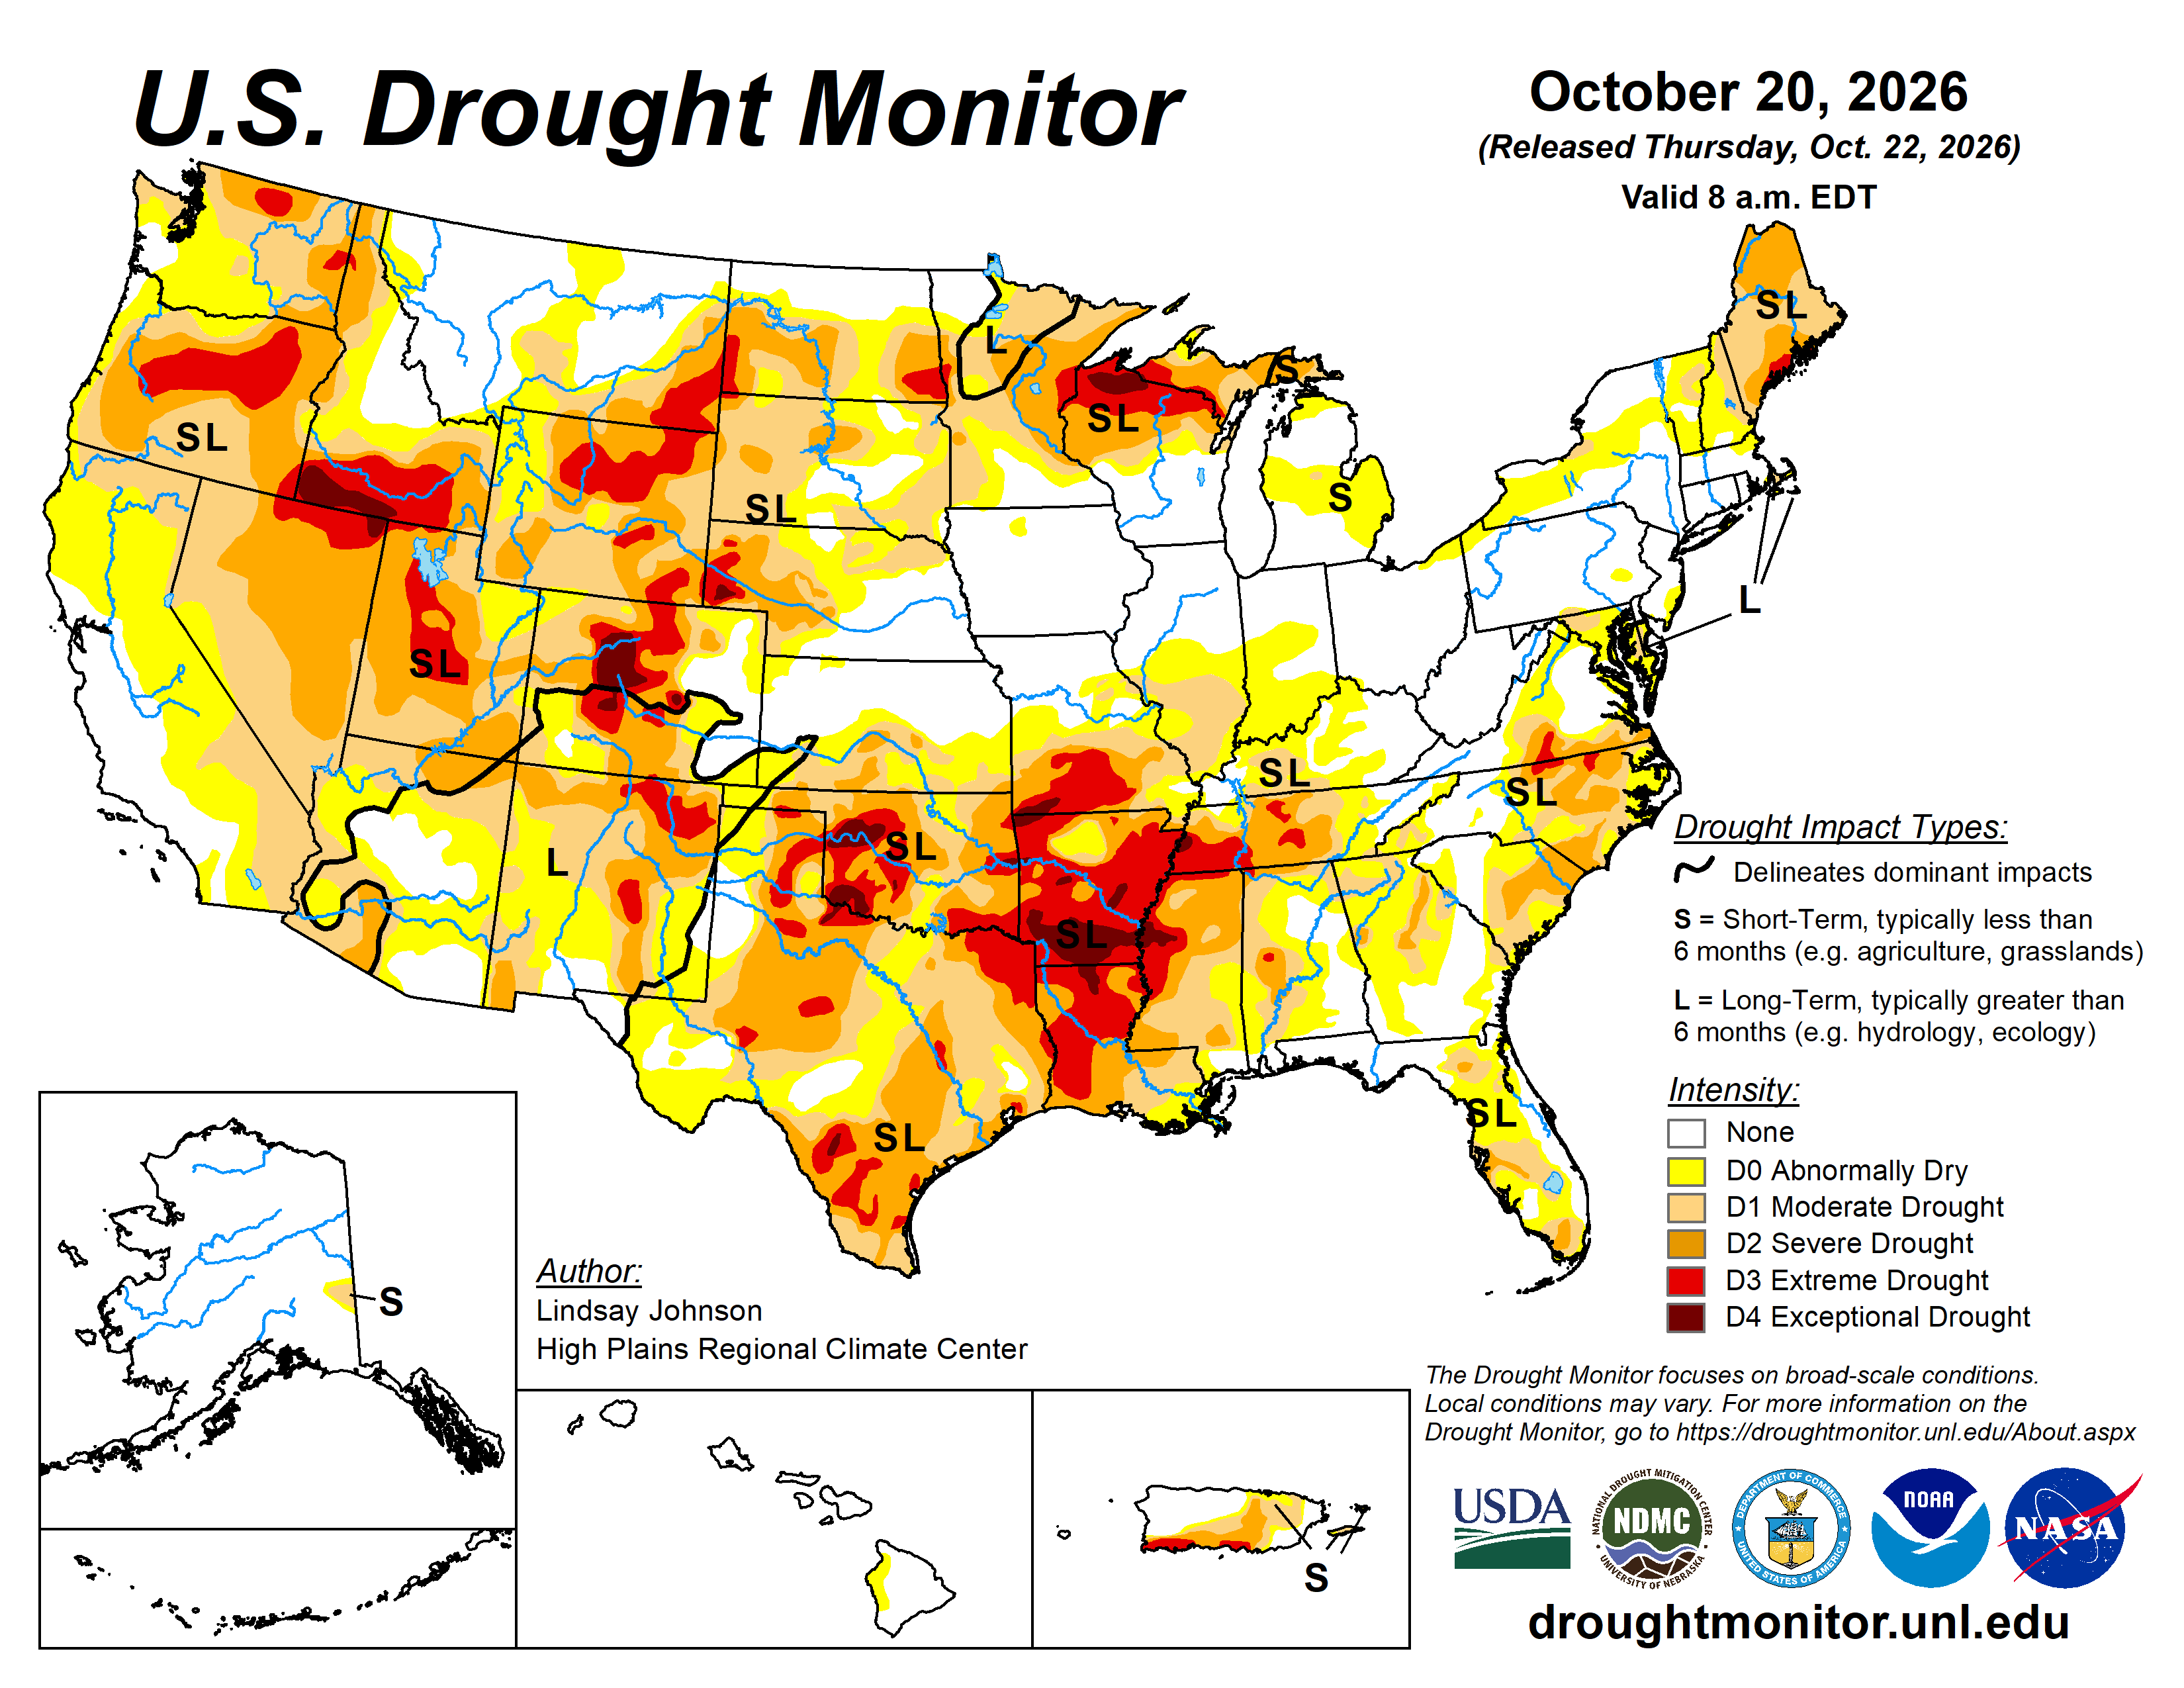
NDMC’s share of the Lower 48 in drought shows here after each Thursday read. The map below is this week’s.
This week’s map, your county’s numbers, and what each category means for crops.
The U.S. Drought Monitor is jointly produced by the National Drought Mitigation Center at the University of Nebraska-Lincoln, the U.S. Department of Agriculture, the National Oceanic and Atmospheric Administration and NASA. Map and data courtesy of NDMC, via https://droughtmonitor.unl.edu.
Source: droughtmonitor.unl.edu · Updated Thursdays by 8:30 AM ET
Next update: -
Is your county in drought this week?
This week’s share in each category, how long it has run, rain this year and the record since 2000. NDMC county numbers and the county’s rain gauge.
The drought map image did not load. See the current map at droughtmonitor.unl.edu.
US · national view
AGSIST's saved copy of the national map.
Source: droughtmonitor.unl.edu
· National Drought Mitigation Center · USDA · NOAA
Drought intensity scale
D0: abnormally dry
D1: moderate drought
D2: severe drought
D3: extreme drought
D4: exceptional drought
Select a state to view its drought map:
Crop stress windows: when drought hurts most
My rule of thumb as a crop adviser, not an NDMC rating. Soil, rooting depth and stored moisture move these a lot.
Crop
Critical Period
Drought Risk
What's at Stake
Corn
Late July – August
D1+ = High risk
Pollination failure; grain fill stunted. Stress at silking costs more yield than at any other stage.
Corn
June (early growth)
D2+ = Moderate risk
Root development impaired; plants stress before they can show it.
Soybeans
Late July – September
D1+ = High risk
Pod set and seed fill, most water-sensitive stage. Yield loss compounds quickly.
Winter Wheat
Fall establishment & spring green-up
D1+ = Moderate risk
Poor tiller development; winter kill risk increases on shallow soils.
Hay / Pasture
May – August
D0+ = Risk begins
First cutting reduced; recovery slows. Supplemental feed costs escalate at D2.
What comes next: NOAA’s rain outlooks
NOAA Climate Prediction Center odds of more or less rain than normal, for next month and the next three months. Green leans wet, brown leans dry; white is equal chances. Copies AGSIST saves when CPC issues them (third Thursday of the month).
Release Schedule
Published every Thursday by 8:30 AM ET. The map reflects conditions through the preceding Tuesday. The national map here is a copy AGSIST saves after each release, labeled with its valid date.
USDA programs and the drought map
Different USDA programs respond to drought in different ways. LFP (Livestock Forage Disaster Program) is tied directly to the USDM: FSA counts weeks with any part of the county in D2, D3 or D4 during the county's normal grazing period (the rule is 7 CFR part 1416). The county box on this page counts those weeks for any county. PRF (Pasture/Rangeland/Forage) is a rainfall-index product and does not use USDM categories. It pays when the grid's rainfall index for an insured interval falls below the coverage level the producer picks, 70% to 90% of normal. See what PRF would have paid on your grid, every year since 1951. WFRP (Whole-Farm Revenue Protection) pays when year-end revenue falls below your insured revenue from any covered cause, not on USDM status. NDMC keeps an LFP drought page for FSA by county.
Regional drought patterns
The western Corn Belt (Iowa, Nebraska, Kansas, South Dakota) and Southern Plains see drought most frequently. Sandy soils drain fast and show stress first in any region. Check your county on the state view and watch the CPC outlook for 1–3 month trend.
Basis Impact
A local drought means fewer bushels coming in, and elevators may bid basis up to get them. A drought rally in futures can pull the other way. Watch both on the Cash Bids page.
Type your county in the box near the top of this page. It shows how much of the county is in each Drought Monitor category on the newest weekly map, the change from a week and four weeks before, how many weeks in a row some part of it has been in drought, rain since January 1 at the county's gauge, and how many weeks since 2000 at least half of it sat in severe drought or worse. The numbers are NDMC's county statistics, read each Thursday after the map comes out.
How does drought affect corn and soybean yields?
Corn is most vulnerable to drought during pollination (late July) and grain fill (August). Drought stress at silking costs more corn yield than stress at any other stage. Soybeans are most sensitive during pod set and fill, roughly late July through early September. Even D1 moderate drought during peak demand can cut yields.
What is D2 drought and what does it mean for farmers?
D2 is Severe Drought on the US Drought Monitor scale. At D2 and above, crop and pasture losses become likely and water restrictions may begin. FSA's Livestock Forage Disaster Program (LFP) counts weeks with any part of a county in D2 or worse during the county's normal grazing period. The county box on this page counts those weeks for any county. D3 (Extreme) and D4 (Exceptional) mean widespread losses and major economic impacts for agriculture. Revenue and rainfall-index insurance products use different mechanisms and are not triggered directly by USDM categories.
When is the US Drought Monitor updated?
The US Drought Monitor is published every Thursday by 8:30 AM ET by the National Drought Mitigation Center, USDA, and NOAA. The map reflects conditions through the previous Tuesday.
Does drought monitor status affect crop insurance?
Different USDA programs work differently. The Livestock Forage Disaster Program (LFP) is tied directly to USDM status: FSA counts weeks with any part of the county in D2, D3 or D4 during the county's normal grazing period. The county box on this page counts those weeks for any county. The Pasture, Rangeland, and Forage (PRF) rainfall-index program does not use USDM categories. It pays when the grid's rainfall index for an insured interval falls below the coverage level the producer picks, 70% to 90% of normal. Whole-Farm Revenue Protection (WFRP) pays on year-end revenue shortfall from any covered cause, not USDM status.
Which states are most affected by drought in the Corn Belt?
Drought impacts in the Corn Belt vary year to year. Each state’s history is in the US Drought Monitor record (droughtmonitor.unl.edu, weekly since 2000). Use the state view on this page to check current conditions for any agricultural state.
How many weeks does my county have to be in D2 before LFP kicks in?
USDA's rule is D2 in any part of the county for at least 4 weeks in a row during the normal grazing period. D3 or D4 anywhere in the county at any time during that period also counts, with no wait.
What's the most LFP will pay me in a year?
Five monthly payments for the same livestock in a calendar year, no matter how many drought ratings the county gets. Each monthly payment is 60 percent of a monthly feed cost, figured on the lower of your herd or your grazing land's normal carrying capacity.
Does grazing corn stalks count for LFP if we're in drought?
No. USDA counts native or improved pasture and crops planted for grazing, like forage sorghum, small grains or annual ryegrass, but not corn stalks or grain sorghum stalks.
Rain: daily NOAA records through RCC-ACIS and NOAA radar with gauges (MRMS). Drought: the U.S. Drought Monitor (NDMC, USDA, NOAA).