US Drought Monitor
Weekly drought conditions for US crop regions. Select national, state, or regional views. Published every Thursday by the National Drought Mitigation Center, USDA, and NOAA.
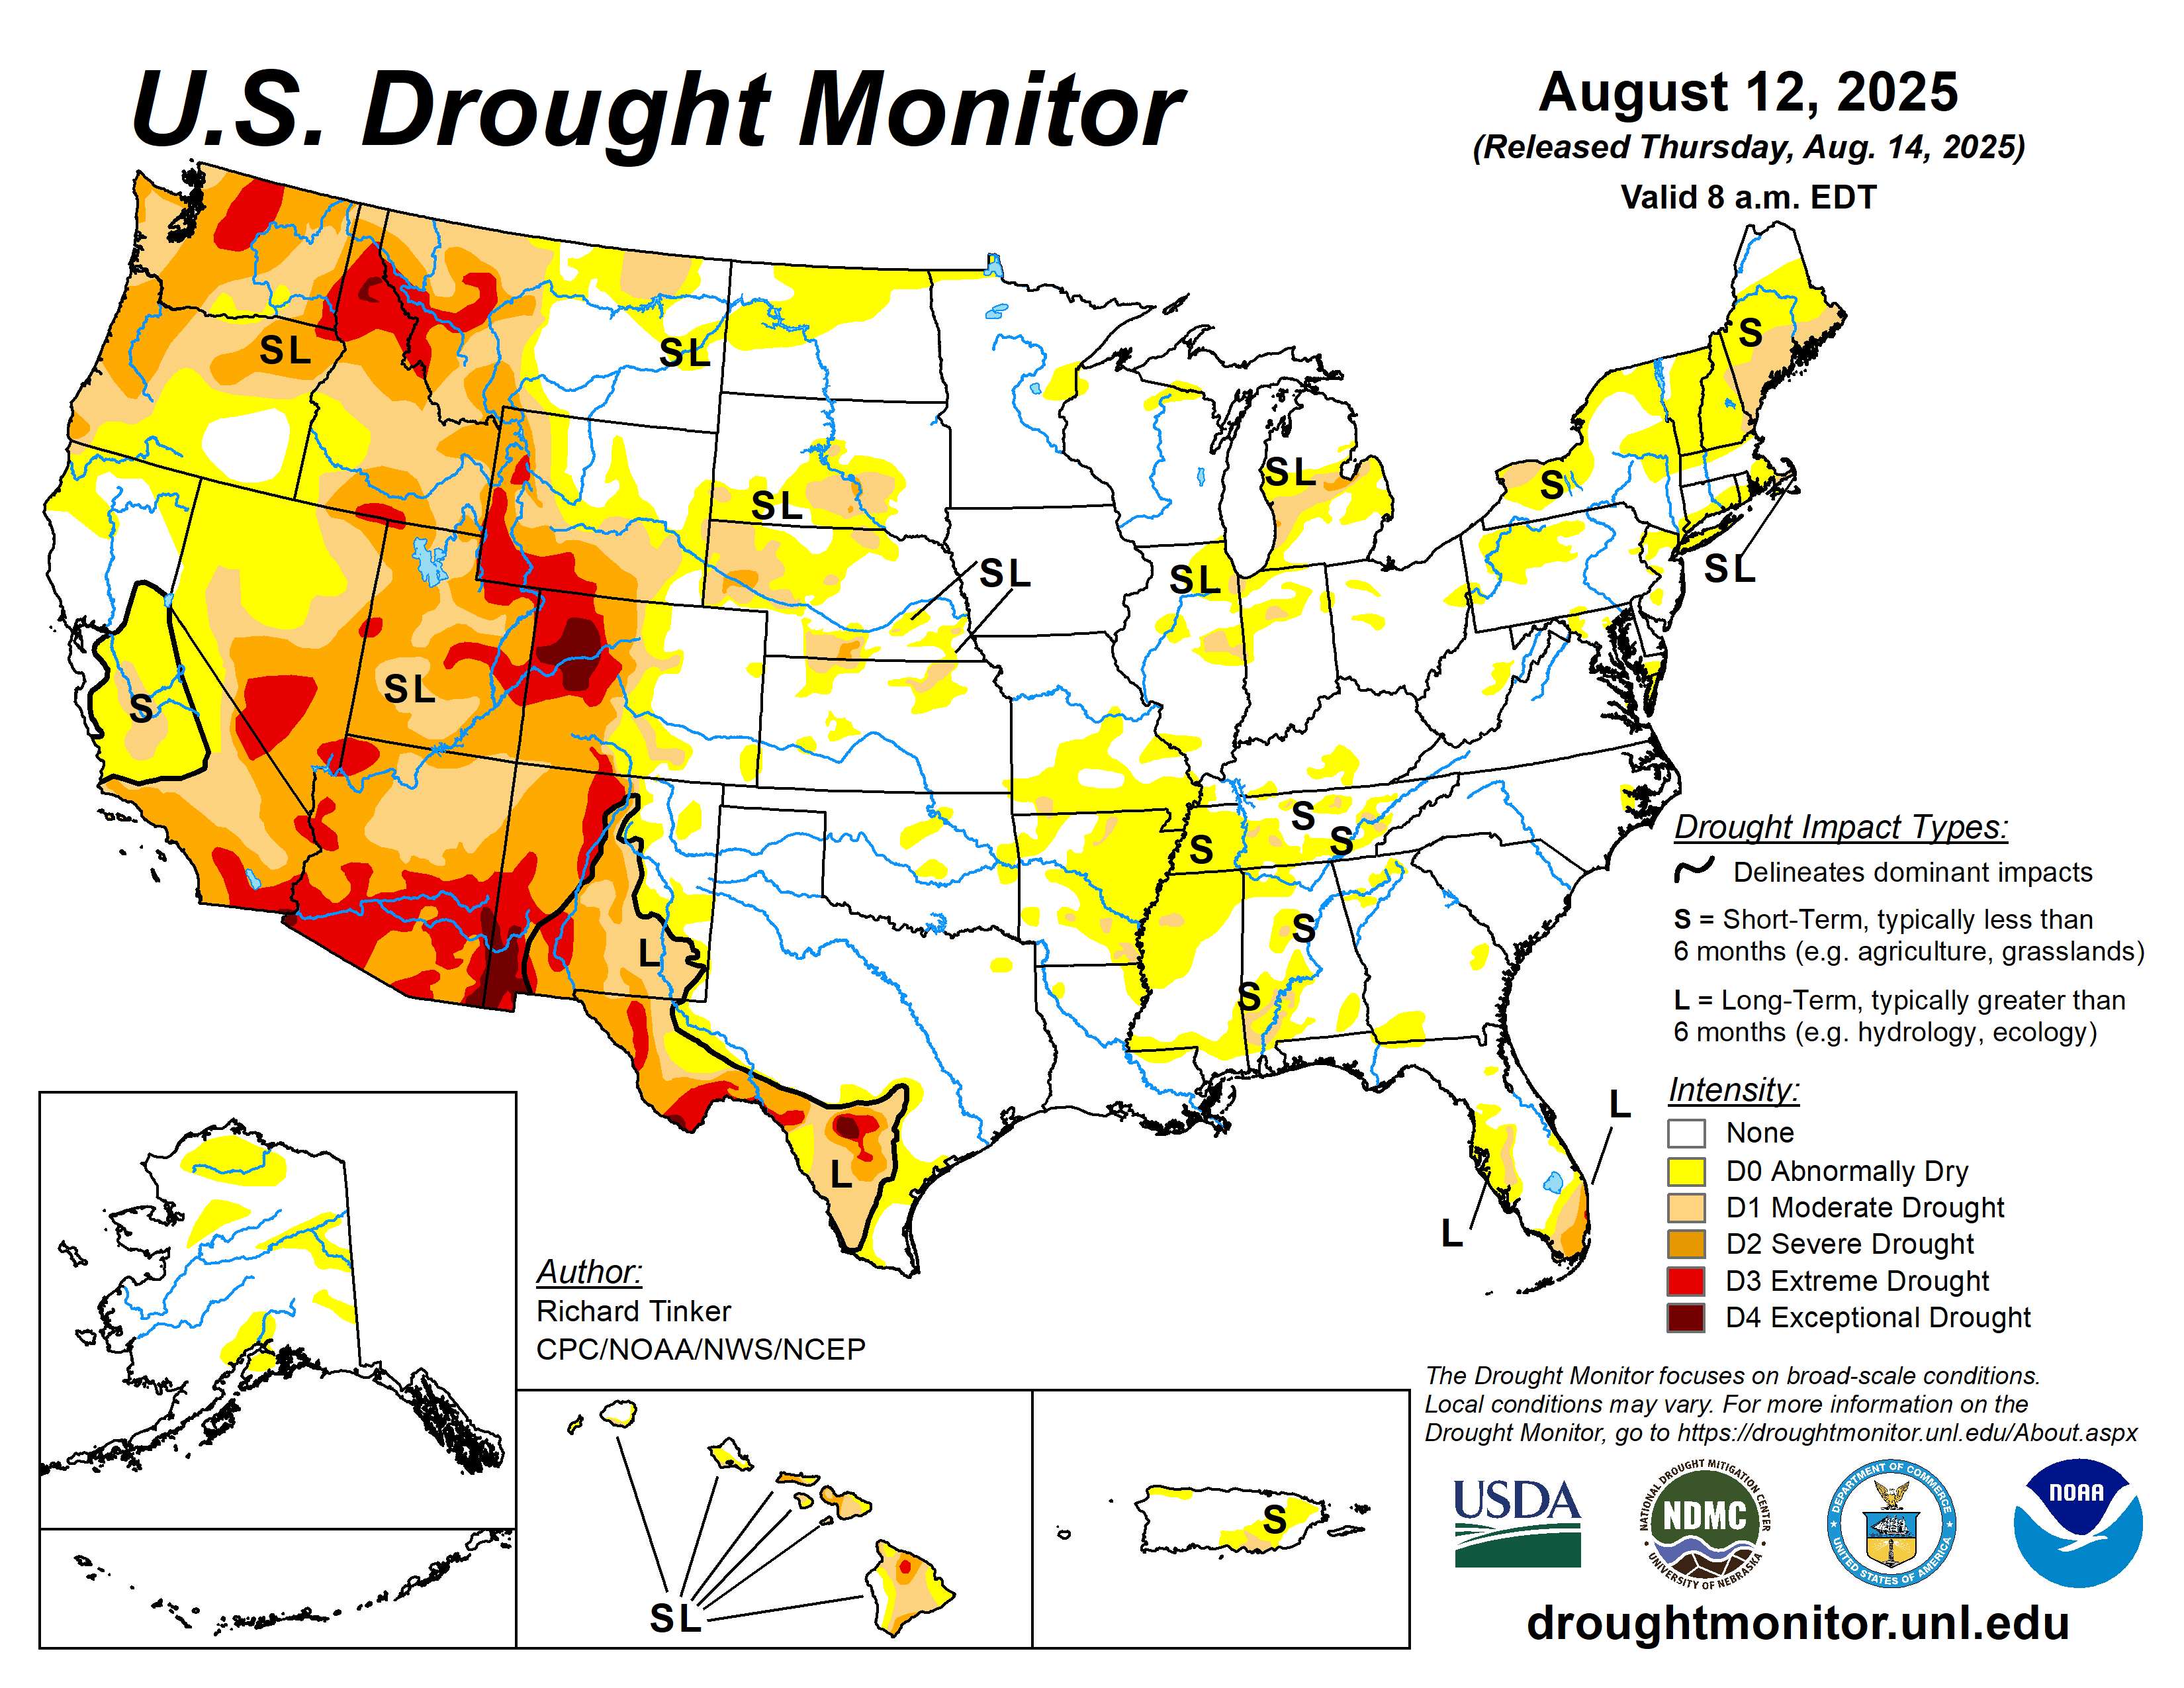 US · National View
| Crop | Critical Period | Drought Risk | What's at Stake |
|---|---|---|---|
| Corn | Late July – August | D1+ = High risk | Pollination failure; grain fill stunted. D2 during silking can cut yield 25–40%. |
| Corn | June (early growth) | D2+ = Moderate risk | Root development impaired; plants stress before they can show it. |
| Soybeans | Late July – September | D1+ = High risk | Pod set and seed fill — most water-sensitive stage. Yield loss compounds quickly. |
| Winter Wheat | Fall establishment & spring green-up | D1+ = Moderate risk | Poor tiller development; winter kill risk increases on shallow soils. |
| Hay / Pasture | May – August | D0+ = Risk begins | First cutting reduced; recovery slows. Supplemental feed costs escalate at D2. |
Release Schedule
Published every Thursday by 8:30 AM ET. The map reflects conditions through the preceding Tuesday. AGSIST links directly to the official NDMC map with no delay or editorial delay.
Crop Insurance & Drought
Different USDA programs respond to drought in different ways. LFP (Livestock Forage Disaster Program) is triggered directly by the USDM: D2 for 8 consecutive weeks, any D3, or D4 for 4 weeks (not necessarily consecutive) in your county. PRF (Pasture/Rangeland/Forage) is a rainfall-index product and does not use USDM categories — it pays when grid precipitation falls below the historical norm. WFRP (Whole-Farm Revenue Protection) pays when year-end revenue falls below your insured revenue from any covered cause, not on USDM status. Check the FSA LFP eligibility tool for your county, and ask your crop insurance agent for specifics on your coverage.
Regional Drought Patterns
The western Corn Belt (Iowa, Nebraska, Kansas, South Dakota) and Southern Plains see drought most frequently. Sandy soils drain fast and show stress first in any region. Once D1+ conditions set in during late June growth, they rarely self-correct without meaningful rain within 10 days. Check your county on the state view and watch the CPC outlook for 1–3 month trend.
Basis Impact
Regional D2+ drought tightens local basis as elevators anticipate reduced receipts. Watch basis move in real time on the Cash Bids page. A drought rally in futures often means basis simultaneously weakens — track both.